Why Distinguish Forecasting Methods from Forecasting Models: They Are Not the Same!
 What
Are Forecasting Techniques? A forecasting technique is a job aid for
forecasters: it creates a simplified representation of reality. The forecaster
tries to include in the representation those factors that are critical and to
exclude those that are not. This process of stripping away the non-essential is
like peeling an onion and focuses on the essentials. This is the essence of
forecast modeling. A forecasting method is a simplified representation
of reality for making projections, usually by means of equations, ratio
calculations or smoothing. Although abstract, forecasting models, on the
other hand, permit the forecaster to estimate the effects of important future
events or trends in the presence of uncertainty.
What
Are Forecasting Techniques? A forecasting technique is a job aid for
forecasters: it creates a simplified representation of reality. The forecaster
tries to include in the representation those factors that are critical and to
exclude those that are not. This process of stripping away the non-essential is
like peeling an onion and focuses on the essentials. This is the essence of
forecast modeling. A forecasting method is a simplified representation
of reality for making projections, usually by means of equations, ratio
calculations or smoothing. Although abstract, forecasting models, on the
other hand, permit the forecaster to estimate the effects of important future
events or trends in the presence of uncertainty.
In the demand for Cable TV/Internet/Telephone, for example, there are thousands of reasons why subscribers want their homes connected or disconnected to a network. It is beyond the scope of the demand forecaster to deal with all these reasons. Therefore, a demand forecaster attempts to distill these many influences down to a limited number of the most pertinent factors. In particular, consider a forecasting method for home telecom services in a major metropolitan area in Michigan, historically a center for major automobile manufacturing. This model assumes that the automobile industry creates jobs for people, who then buy homes or rent apartments and desire cable services. The demand forecaster's job, in this instance, is to determine the relationships among employment levels, household growth, land use, and cable service demand along with a measure of forward-looking uncertainty. The forecasting process might look like this:
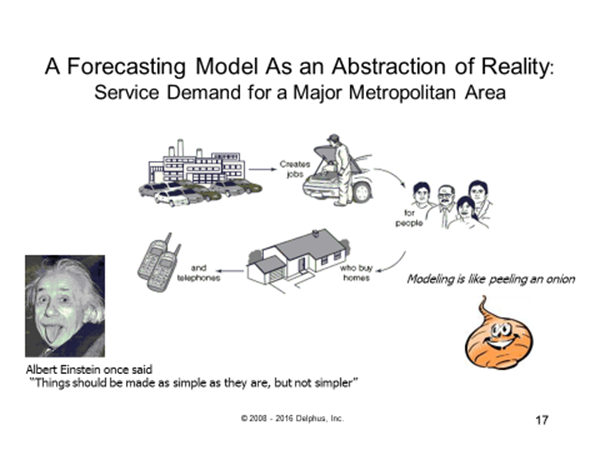
Mathematical equations are used to develop Forecasting Models that can represent a real-world situation with stated uncertainty. A demand forecast embraces both Change and Chance. For an internet service model, such an equation might take the form
Cable service demand = β 0 + β 1 (Employment) + β 2 (Number of housing starts) + random error term,
where β 0, β 1, and β 2 are coefficients determined from historical data. In statistical models, it is a convention to use Greek symbols to describe unknown parameters to be estimated from data.
Forecasting methods, on the other hand, can simplify the analysis of some problems, but, of course, sacrifice the ability to account for all the factors that cause people to behave as they do; in particular forward-looking uncertainty. Remember: Uncertainty is a certain factor.
Notice that a forecasting method summarized by an equation might not include other information such as the prices of other goods and services, but especially uncertainty! Uncertainty is an explicit (i.e. certain) factor in a forecasting model, which is the next layer of model identification.
For another forecasting example, consider tourism demand, a service quantity. International tourism has become a major part of the global trade. Tourism demand measures a visitor’s use of a quantity of a good or service, such measures commonly found in tourism forecasting include number of visitors to a destination, number of transportation passengers, and amount of tourism expenditures. Some factors that are known to affect tourism demand include personal disposable income, travel costs, natural and human-made disasters, and weather.
Based on an exploratory ANOVA decomposition method, we can infer from the pie chart that the total variability in the data can be thought of as 86.6 % seasonality, 12.1 % trend and 1.3% irregular (unknown, other than trend/seasonal effect). The primary driver, in this example, is seasonality, so a model with a seasonal-trend forecasting profile (e.g. Holt-Winters or ARIMA ‘airline model’) should a credible first choice for creating forecasts with forward-looking uncertainty (e.g. prediction intervals). Forecasters need to understand the factors driving consumer demand and consumer trends in their areas in order to create a demand forecast for a product or service. What other factors of demand or domain knowledge might you need to consider describing the tiny remaining percent variation?
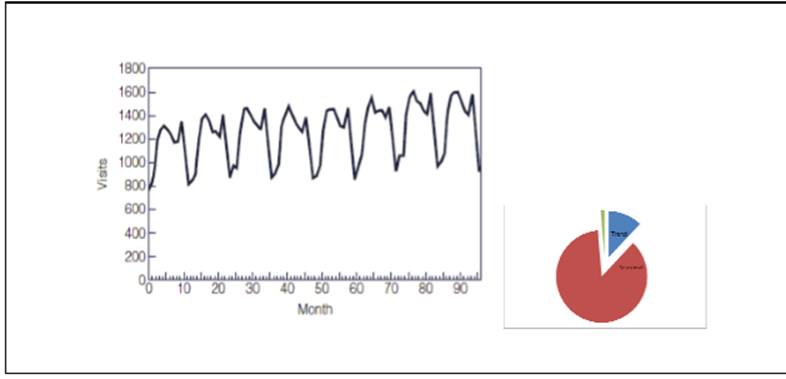
Exhibit. Time Plot and Exploratory Trend-Seasonal Decomposition of Monthly Tourism Demand in a Metropolitan Area. Source: Frechtling, D.C. (1996). Practical Tourism Forecasting. Oxford: Butterworth-Heinemann.
There is a trade-off between simplicity and completeness in every model-building effort. Multiequation causal models are commonly used to approximate the relationships between retail sales and its drivers: price, advertising spending, coupons, competitive influences and seasonality. Because seasonality is such a dominant factor, the data is often seasonally adjusted first before modeling begins. It is predominantly trending, so factors relating to consumer growth would be needed. Note, the dependence on the economic cycle – the drop off during the latter half of 2008. On the premise that there is a strong relationship between consumer purchases and factory shipments a related causal model around factory shipments would include among its drivers retail consumption, merchandising, trade allowances and promotional lift variables.
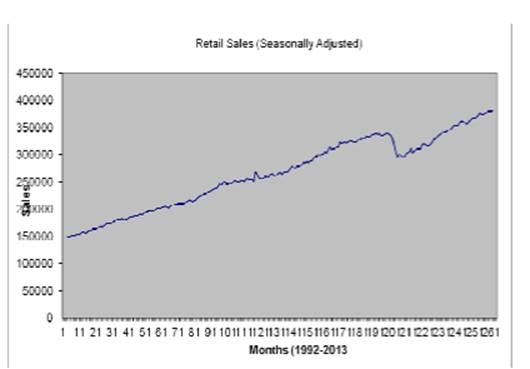
Exhibit. Time Plot Monthly Retail Sales, adjusted for seasonal variations, trading-day and holiday differences. Source: US Bureau of Census
Modeling and projection techniques are tangible and structured, just like the forecasting process. Along with the forecast numbers, statistical forecasting models can produce forward-looking measures of uncertainty and objective, reproducible results. As the analytical engine of a forecasting model, projection techniques provide the basis for understanding forecast profiles and forecast error impacts (conventionally defined as Actual – Forecast!). Models perform similar tasks regardless of the data they use; although some inputs to the forecasting process depend on the nature of the given situation, projection methods do not. For this reason, the forecaster must exercise informed judgment in selecting and using the projection techniques that yield the desired forecast profiles. Through a systematic, iterative process of elimination, the forecaster can identify those projection techniques that will provide the greatest credibility in the development of the forecast output.
A forecasting technique is a systematic procedure for producing and analyzing forecasts.
When forecasting, one should analyze and forecast variables by emphasizing the most widely practiced and accepted forecasting approaches. We begin an analysis with traditional approaches and need to follow them with non-conventional resistant (those that safeguard against outlıers and unusual values) and robust (those that safeguard against departures from classical modeling assumptions) complements to the same problems. More advanced techniques, including the univariate ARIMA (AutoregressiveIntegrated-Moving Average) models, based on the Box-Jenkins methodology, and some multi-variable approaches, like dynamic regression and econometric modeling should also be considered in time, if appropriate.
Hans Levenbach is Executive Director, CPDF Training and Certification Programs. He conducts hands-on Professional Development Workshops on Demand Forecasting for multi-national supply chain companies worldwide. He is group manager of the LinkedIn groups (1) Demand Forecaster Training and Certification, Blended Learning, Predictive Visualization, and (2) New Product Forecasting and Innovation Planning, Cognitive Modeling, Predictive Visualization.